Amazon A+ Content Video: The A/B Testing Guide for Brand Owners
Amazon A+ Content Video: The A/B Testing Guide for Brand Owners

Specifically, in early 2024, a California-based beauty brand ask us how to optimize their Amazon A+ Content Video strategy. With three hero SKUs doing over $3M combined on Amazon they had professional assets but underperforming conversion rates: their A+ Content was live, their videos were professional, and their listings looked good — but two of their three SKUs had CVRs hovering below 11%. For their category, this was underperforming by about 3 points.
In fact, they hadn't changed anything on those listings in eight months. That was the problem.
In high-volume Amazon selling, a listing that isn't being tested is a listing that's slowly falling behind. Buyer behavior shifts. Competitive pressure changes. What converted well in Q1 may not be the best performer by Q3. The brands consistently pulling ahead aren't the ones with the best creative instincts — they're the ones running the most rigorous testing cycles.
What This Amazon Video Guide Covers
──────────────────────────────────────────────────
This guide covers exactly how to A/B test Amazon A+ Content video, what variables actually move the needle, how to use Amazon's native tools and supplement them where they fall short, and what a data-driven testing cycle looks like for sellers operating at scale.
The Importance of Amazon A+ Video Testing
──────────────────────────────────────────────────
Most sellers treat their A+ Content and listing videos as finished assets. Once they're live and performing "okay," they get deprioritized in favor of PPC, inventory, or new product launches.
This is one of the most expensive passive decisions a high-volume seller makes.
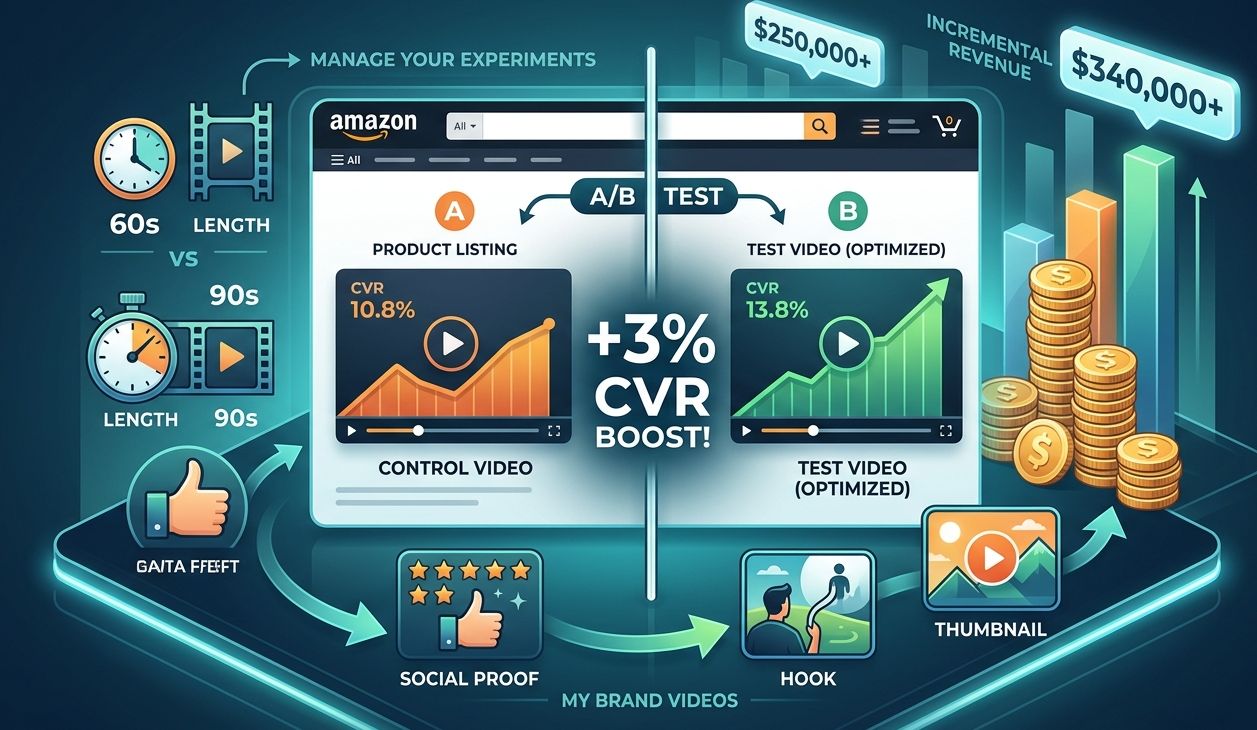
Here's the math: a seller with $2M in annual revenue and a 12% CVR who improves to 13.5% through systematic testing generates approximately $250,000 in additional revenue from the same traffic. No additional ad spend, new products or price changes. Just a better-converting listing.
That 1.5-point CVR improvement is conservative. In our work with brands in the $1M–$10M range, structured A/B testing cycles on Amazon A+ Content video consistently produce CVR improvements between 8% and 22% relative to the control. The brands capturing those gains aren't doing anything exotic. Instead, they test methodically, read the data, and implement what works.
The sellers who don't test are effectively donating that revenue to whoever on the SERP is willing to run the experiments.
Native Tools for your Amazon A+ Video Strategy
──────────────────────────────────────────────────
Additionally, before building a testing strategy, it's important to understand what Amazon gives you natively and where the gaps are.
Furthermore, Manage Your Experiments (MYE) is Amazon's built-in A/B testing tool available to Brand Registry sellers. It allows you to test two versions of the same listing element simultaneously — including A+ Content modules, product titles, main images, and bullet points — and measures which version drives more sales over a defined test period.
What it does well:
• Runs true controlled experiments with real purchase data
• Reports statistical significance so you know when a result is reliable
• Covers A+ Content module layout and copy variations
• Tests main images, which is one of the highest-leverage variables on any listing
What it doesn't do:
• Direct video-to-video A/B testing within the A+ video module is not currently supported as a head-to-head experiment in MYE
• It only measures final purchase conversion, not intermediate engagement signals like video play rate, watch time, or scroll depth
• Test cycles run 4–10 weeks, which means fast iteration isn't possible with MYE alone
This is why sophisticated sellers combine MYE for what it does well (A+ modules, main images, titles) with third-party analytics and structured rollout testing for video variants.
Top Variables for Amazon A+ Video Optimization
──────────────────────────────────────────────────
First, not every element of your video has equal testing value. These are the variables with the highest measured impact on CVR, ranked by the consistency of their effect across categories:
▸ 1. The Amazon A+ Video Thumbnail (highest impact)
For instance, the thumbnail is the still frame shown before a buyer hits play. It's essentially the "main image" of your video — and it has a dramatic effect on play rate, which is the prerequisite for everything else.
Variables to test:
• Product-only shot vs. product in use with a human subject
• Lifestyle context (kitchen, gym, office) vs. clean studio background
• Text overlay with core benefit vs. no text overlay
• Emotional tone: aspirational vs. functional
We've measured thumbnail changes alone driving 25–40% differences in video play rate. Consequently, a video that doesn't get played converts at zero — so this is the first variable to get right.
▸ 2. Opening 5 seconds
Since most Amazon video plays happen with audio off, and since most viewers decide in the first few seconds whether to keep watching, the opening is disproportionately important.
Test these two structures head to head:
Benefit-led: Open with the product's core outcome stated visually. "No more back pain during your commute" over a lifestyle shot. Assumes the buyer is already aware they have the problem and is evaluating solutions.
Problem-led: Open with the pain point visualization — someone struggling with the exact problem your product solves. "Sound familiar?" More effective for products solving problems buyers haven't yet named.
The winning structure varies by category and price point. Problem-led tends to outperform for products under $50 in everyday categories. Benefit-led tends to outperform for premium and aspirational purchases above $100.
▸ 3. Video length
The question of whether your audience wants more or less information from your Amazon A+ Content Videos consistently than you're currently giving them is best answered with data, not intuition.
Test a 60-second version against a 90-second version of the same content. In most commodity categories — personal care, household goods, basic kitchen — the shorter version wins. In considered purchase categories — fitness equipment, professional tools, tech accessories — the longer version that addresses objections more thoroughly tends to convert better.
The insight here isn't just which length wins. It's what the data tells you about how much your buyer needs to trust before converting, which informs every other creative decision you make.
▸ 4. Social proof placement and format
Similarly, where testimonial content appears in your video and what form it takes significantly affects conversion.
Test customer testimonial clips (real buyers on camera) against on-screen review excerpts with star ratings, testimonials appearing in the first third of the video versus the final 20 seconds. Test a single strong testimonial against two or three shorter ones.
For high-ticket products, face-to-camera testimonials from buyers who match your target customer profile tend to outperform text-based social proof significantly. For lower-ticket, higher-velocity products, brief review callouts can be equally effective with less production overhead.
▸ 5. The closing call-to-action
Finally, how your video ends — the final frame a buyer sees — is an underutilized conversion lever.
Test a product-forward close (clean product shot, key benefit text, brand logo) against an urgency close ("Limited quantities available" or "Ships in 24 hours") against a social proof close ("4.8 stars · 2,400+ reviews"). The winning format tells you what psychological driver is most active in your buyer's decision at the moment they finish watching.
A+ Content Video Testing Cycle
──────────────────────────────────────────────────
To begin with, random testing produces random insights. Systematic testing produces compounding improvements. Here's the framework we use with clients running structured optimization cycles:
Phase 1: Data Baseline and Isolation
Step 1: Establish your baseline with clean data Before testing anything, document your current CVR, unit session percentage, and return rate across a minimum 30-day window. Pull from your Business Reports in Seller Central. This is your control. Without a documented baseline, you can't measure impact.
Step 2: Isolate one variable per test
The most common testing mistake is changing multiple elements simultaneously. If you update your video thumbnail AND your A+ layout at the same time and your CVR improves, you don't know which change drove the result. One variable per test, always.
Phase 2: Execution and Tools
Step 3: Run Manage Your Experiments for A+ module layout
Use MYE to test your A+ Content module arrangement. Specifically, test whether leading with your Amazon A+ Content video module or placing it lower in the content stack performs better. Set your experiment for a minimum of four weeks and aim for 90% statistical significance.
Step 4: Use external analytics for video-specific metrics
For variables MYE doesn't measure — play rate, watch time, replay rate — supplement with pixel-level analytics tools. Brands using Amazon Attribution can layer in behavioral data to see how buyers interact with your video before converting.
Phase 3: Implementation
Step 5: Implement, document, and queue the next test
Once a test reaches statistical significance, implement the winner immediately. Document what you learned—not just "Version B won" but why you believe it won. Build a rolling testing backlog of at least three future experiments.
The brands seeing the largest compounding improvements are running this cycle continuously, not as a quarterly initiative.
Best Placement for the Amazon A+ Video Module
──────────────────────────────────────────────────
One of the most frequent questions we get from California-based brands optimizing high-volume listings is whether to lead their A+ Content with the video module or anchor it further down the page.
The data-informed answer: it depends on buyer intent and product complexity.
For products with a strong visual story — lifestyle goods, fitness equipment, beauty, home décor — placing the video module as the first A+ element after the bullet points increases play rates significantly. The buyer is already in an evaluation mode and the video accelerates the decision.
For products where the purchase decision is more spec-driven — electronics accessories, industrial tools, professional equipment — buyers tend to scan the technical comparison charts and feature modules first, then engage with the video as confirmation rather than discovery. In these cases, video placed after the feature modules often sees higher completion rates because the buyer arrives at it already partially convinced.
Test both. Your specific buyer and product combination will have a clear winner, and MYE can surface it within a standard experiment cycle.
What Separates a Data-Driven Video Strategy from Intuition-Based Creative
──────────────────────────────────────────────────
The most important shift a high-volume seller can make isn't in their creative quality — it's in how they make creative decisions.
Intuition-based creative: "This looks better." "Our designer thinks this version is stronger." "We tested this with our internal team and they preferred Version B."
Data-driven creative: "Version B produced a 14% higher CVR over a 6-week test period with 94% statistical confidence. Here's what we believe drove the difference and what we're testing next."
The brands we work with who have made this shift — treating their Amazon listing and A+ Content Video as a living, testable asset rather than a finished product — consistently outperform their category competitors over 12–24 month periods, even when those competitors have larger budgets and larger teams.
The edge isn't resources. It's process.
What the California Brand Did Next
──────────────────────────────────────────────────
Returning to the brand from the introduction: we ran four testing cycles over six months on their two underperforming SKUs. The variables we tested, in order: video thumbnail, A+ module placement, opening 5-second structure, and testimonial format.
As a result, by the end of cycle four, both underperforming SKUs had moved from sub-11% CVR to 14.2% and 13.8% respectively.
Combined with the return rate improvements from the clearer product demonstrations we built into the winning video versions, the total revenue impact over that six-month period was approximately $340,000 in incremental sales — from the same traffic, the same ad spend, and the same products.
That's what a structured A/B testing cycle looks like when it's executed consistently.
Ready to Build a Testing Strategy for Your Listings?
──────────────────────────────────────────────────
At My Brand Videos, we work with Amazon sellers across California and nationally who are serious about data-driven listing optimization.
In conclusion, we build the testing strategy alongside the creative, so every asset we produce has a clear measurement plan from day one.
Therefore, if your top ASINs haven't been through a structured video testing cycle in the last 90 days, you're almost certainly leaving conversion gains on the table.
Schedule a free A+ Content audit →
We'll review your current A+ Content setup, identify the highest-leverage testing opportunities on your top three ASINs, and walk you through what a testing roadmap looks like for your specific category.
