Amazon Video Analytics: How to Track Performance
Amazon video analytics is the practice that transforms video from a gut-feel creative decision into a data-driven optimization cycle. Without systematic measurement, sellers produce video, publish it, and have no reliable way to determine whether it's performing — or how much performance they're leaving untested. With proper analytics, every video asset becomes an input into a continuously improving creative system.
This guide covers which Amazon video analytics metrics actually matter, where to find them, and how to interpret them in a way that drives better creative decisions rather than just generating numbers on a dashboard.
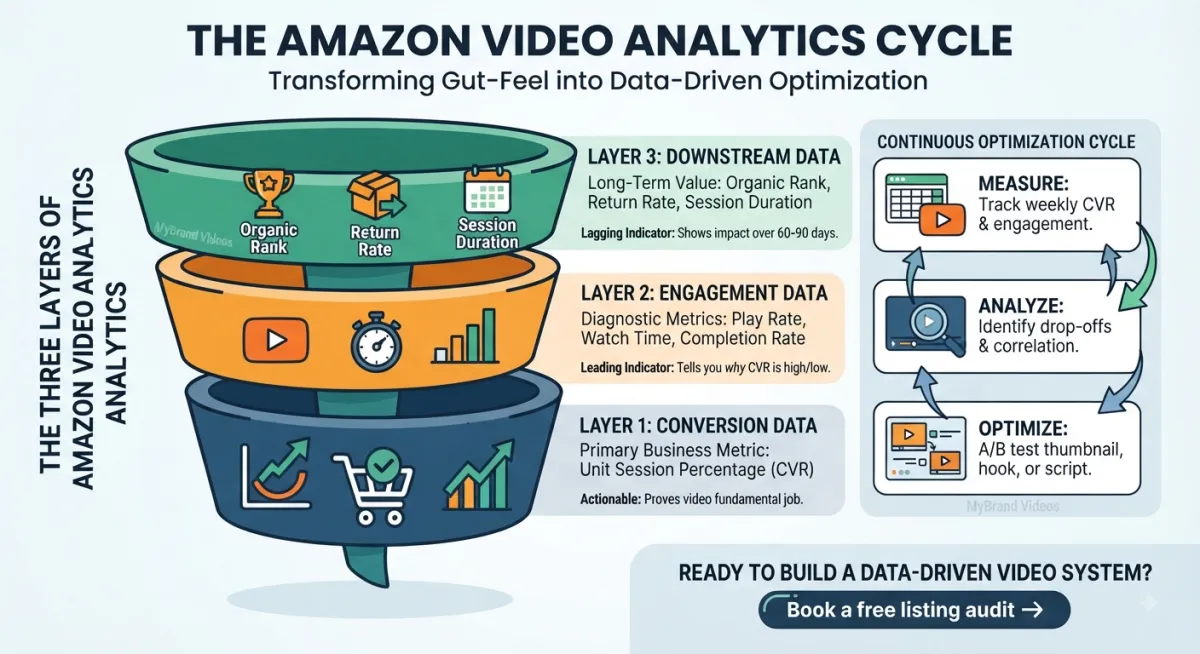
The Three Layers of Amazon Video Analytics
Amazon video analytics operates across three distinct data layers, each requiring different tools and providing different types of insight.
Layer one: conversion data. This is the most important layer and the most directly actionable. Conversion rate — specifically unit session percentage in Seller Central — is the primary measure of whether video is doing its fundamental job. Tracking CVR before and after video implementation, and comparing CVR between test variants, provides the clearest evidence of whether video is moving the business metric that matters most.
Layer two: engagement data. Beyond conversion, engagement metrics tell you how buyers are interacting with video content specifically — play rate, watch time, completion rate. These metrics are available through third-party analytics tools and, partially, through Amazon Attribution for external traffic. Engagement data is leading indicator data: low play rate tells you the thumbnail needs work before CVR can improve; high drop-off in the first 10 seconds tells you the hook isn't working regardless of how strong the rest of the video is.
Layer three: downstream data. Organic rank movement, return rate changes, and session duration on the listing page are downstream consequences of video performance that build over time. This layer is slowest to show movement — often 60 to 90 days behind video implementation — but represents the most significant long-term value of strong video performance.
Key Amazon Video Analytics Metrics and What They Tell You
Play Rate
Play rate measures what percentage of buyers who see the listing actually press play on the video. Low play rate — typically below 25 percent — indicates that the thumbnail isn't compelling enough to drive engagement, regardless of how well the video itself is produced. Consequently, thumbnail optimization is always the first intervention when play rate is the identified problem.
High play rate (above 40 percent) with low conversion suggests the video content itself isn't converting, even though buyers are watching — which points to scripting or structural issues rather than thumbnail problems.
Watch Time and Completion Rate
Watch time data tells you where buyers stop watching — which is often more useful than knowing how many finish. A sharp drop-off at a specific point in the video identifies exactly which segment is losing viewers, which is directly actionable for editing.
Completion rate above 70 percent is generally strong for Amazon listing video. Below 50 percent suggests either the video is too long for the content it contains or there's a specific segment where the majority of buyers disengage.
Video-Attributed Conversion Rate
Where analytics tools allow isolating conversions specifically attributable to video interaction — buyers who played the video and then purchased — this metric provides the clearest measure of video's direct conversion contribution. It's distinct from overall listing CVR because it isolates the buyer segment that actually engaged with the video rather than purchasing despite not watching.
Where to Find Amazon Video Analytics Data
The data sources available for Amazon video analytics are fragmented across multiple platforms, which is one reason many sellers don't track video performance systematically.
Seller Central — Business Reports. Unit session percentage and conversion data at the ASIN level. This is the foundational data source for measuring whether CVR has improved following video implementation. Download weekly and compare against pre-video baseline.
Amazon Brand Analytics. For Brand Registry sellers, Brand Analytics provides additional buyer behavior data including search term performance and category benchmarks. Used alongside Seller Central data, it provides context for whether CVR improvements are outpacing or underperforming category trends.
Amazon Attribution. For sellers driving external traffic to Amazon listings, Attribution provides engagement data including video play events from external traffic sources. This is the closest native Amazon tool to video-specific analytics for sellers using off-Amazon marketing.
Third-party tools. Several established tools provide video engagement metrics at the ASIN level, including estimated play rate and completion data derived from public Amazon data signals. These aren't perfect measurements, but they provide directional insight that native Amazon tools don't currently surface for all sellers.
Building an Amazon Video Analytics Tracking Routine
The most important factor in effective video analytics isn't the sophistication of the tools — it's consistency of measurement over time. A simple tracking routine applied consistently produces more actionable insight than a complex analytics setup reviewed sporadically.
Weekly Tracking (15 minutes)
Every week, pull unit session percentage from Business Reports for your primary video-enabled ASINs. Log it in a simple spreadsheet with the date. Flag any week where CVR moves more than 2 percentage points in either direction for follow-up investigation.
Monthly Review (30 minutes)
Monthly, review the trend across weekly CVR data, compare return rates from the previous month against baseline, and check keyword rank position for your top 5 to 10 priority terms. This monthly review is where organic rank improvements — the slowest-moving but most significant downstream metric — first become visible.
Post-Test Analysis (after each A/B test)
When a structured A/B test concludes, document results specifically: which variant, what the performance difference was, what the likely reason for the difference is, and what hypothesis this suggests for the next test. This documentation is the asset that makes each test cycle more informed than the last.
Common Amazon Video Analytics Interpretation Mistakes
Several recurring mistakes cause sellers to draw wrong conclusions from video analytics data.
Confusing correlation with causation. A CVR improvement in the week after video goes live might reflect the video — or a competitor going out of stock, a seasonal traffic shift, or a pricing change made simultaneously. Without a controlled test, attribution is uncertain. This is the core argument for structured A/B testing alongside analytics tracking.
Measuring too early. The organic rank improvement driven by video typically manifests 60 to 90 days after implementation. Sellers who evaluate video ROI at 30 days and find organic traffic unchanged are simply measuring before the mechanism has activated.
Treating engagement metrics as success metrics. High play rate and high completion rate are valuable — but they measure engagement, not conversion. A video that buyers enjoy watching without purchasing is not performing well regardless of its engagement metrics.
Ready to Build a Data-Driven Video Tracking System?
At MyBrand Videos, every production we deliver includes guidance on which metrics to track and how to interpret them as the video goes live — so clients aren't just receiving creative assets but a measurement framework alongside them.
Related articles:
